


What are initial jobless claims
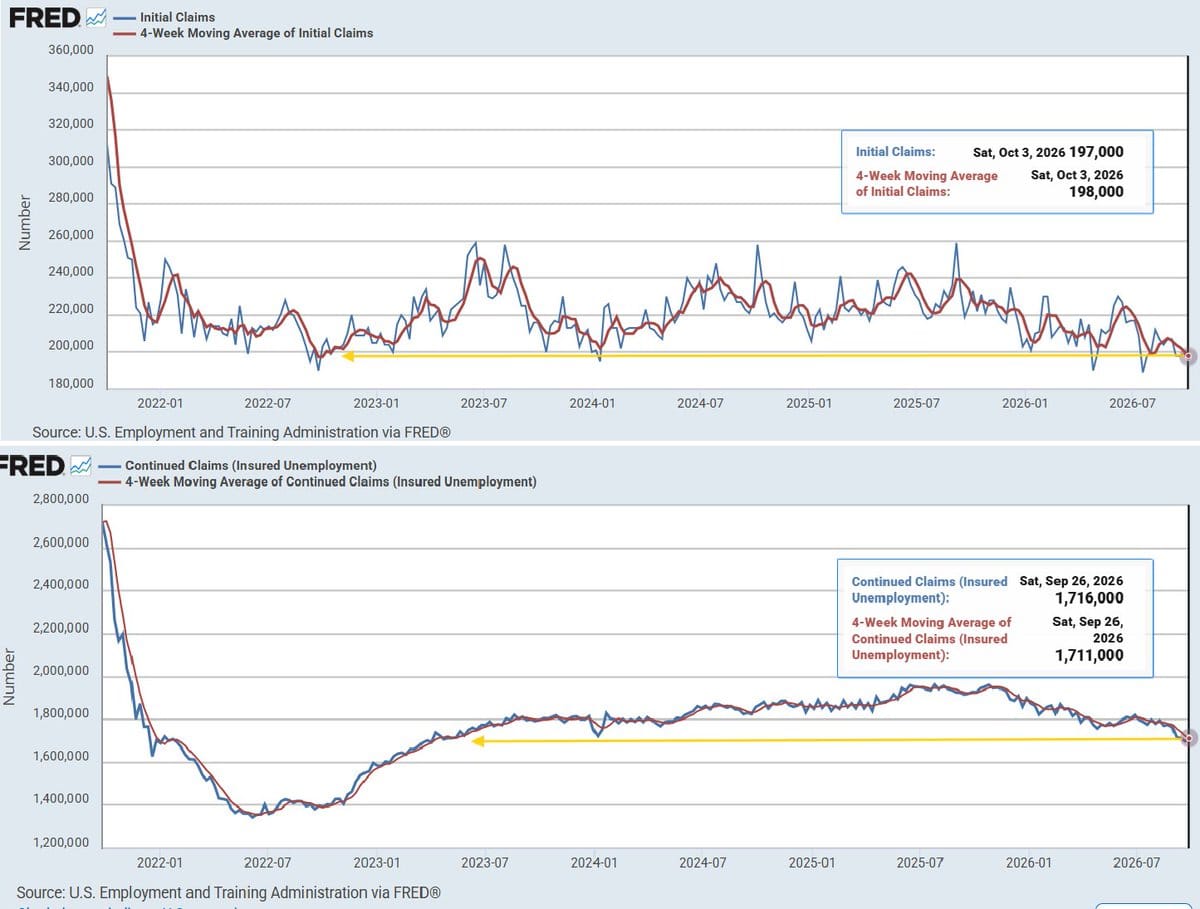
Initial claims count people filing for state unemployment insurance for the first time after losing a job. The Department of Labor (DOL) publishes the national total every Thursday, covering the week ended the previous Saturday. The latest release showed 197,000 seasonally adjusted claims for the week ended October 3, with the four-week moving average at 198,000.
Continued claims, which count people already receiving benefits, come in the same release but run a week behind. They stood at 1.716m for the week ended September 26.
Think of the series as a smoke detector. It tells you whether layoffs are happening, not whether the house is thriving.
Why it matters
Claims are one of the fastest official labor indicators. The Bureau of Labor Statistics (BLS) publishes its Employment Situation report once a month. Claims arrive every week, so they can show a turn in firing before payrolls do. Past recessions were preceded by sustained rises, with claims typically climbing well above their cycle low first.
The number also feeds policy. Fed officials have cited readings below 200,000 as evidence that the labor market can absorb tighter policy while inflation stays elevated, which puts a weekly statistic into the argument over the next FOMC decision.

How to interpret it
A single print proves little. Holidays, weather and state reporting quirks can move any one week, and the four-week average smooths that noise. Compare it with its recent low.
Initial and continued claims belong together. Initial claims show how many people lose jobs; continued claims show how long they stay out of work. Low initial claims alongside rising continued claims mean firing is rare but people who lose jobs are slow to find new ones.
The series also misses a lot. Only workers eligible for insurance can file, so many self-employed people, gig workers and new entrants to the labor force never appear, and only a minority of the unemployed collect benefits. State rules and whether people know they can apply shape the count too.
Scale matters as well. The labor force is far larger than in earlier decades. As a rough estimate, 197,000 claims is about 0.13% of roughly 150m covered workers. That is close to the lowest share the series has recorded, even though raw counts were lower in earlier decades.
Other data fills the gaps. The Job Openings and Labor Turnover Survey (JOLTS) covers hires, quits and layoffs. The BLS household survey produces the unemployment rate, which includes people that claims never capture.
Key takeaways
- A low print means few insured workers are being laid off. It says nothing about hiring, wages or participation.
- The four-week average and continued claims tell you more than any single week.
- Claims cover only part of the unemployed, so they supplement the unemployment rate rather than replace it.
What would change the read:
- The four-week average rising toward 230,000 or more.
- Continued claims staying above roughly 1.9m.
- Claims and the BLS unemployment rate both rising at once.
If any of these showed up, the layoff cushion would have thinned.
Main sources
- DOL Unemployment Insurance Weekly Claims Report
- DOL Employment and Training Administration (ETA) unemployment insurance claims data
- FRED: Initial Claims (ICSA)
- FRED: Continued Claims (CCSA)
- BLS: Seasonal adjustment for weekly unemployment insurance claims
- BLS Employment Situation
Listen to this article
Prefer audio? The full piece, read aloud.
Discussion