


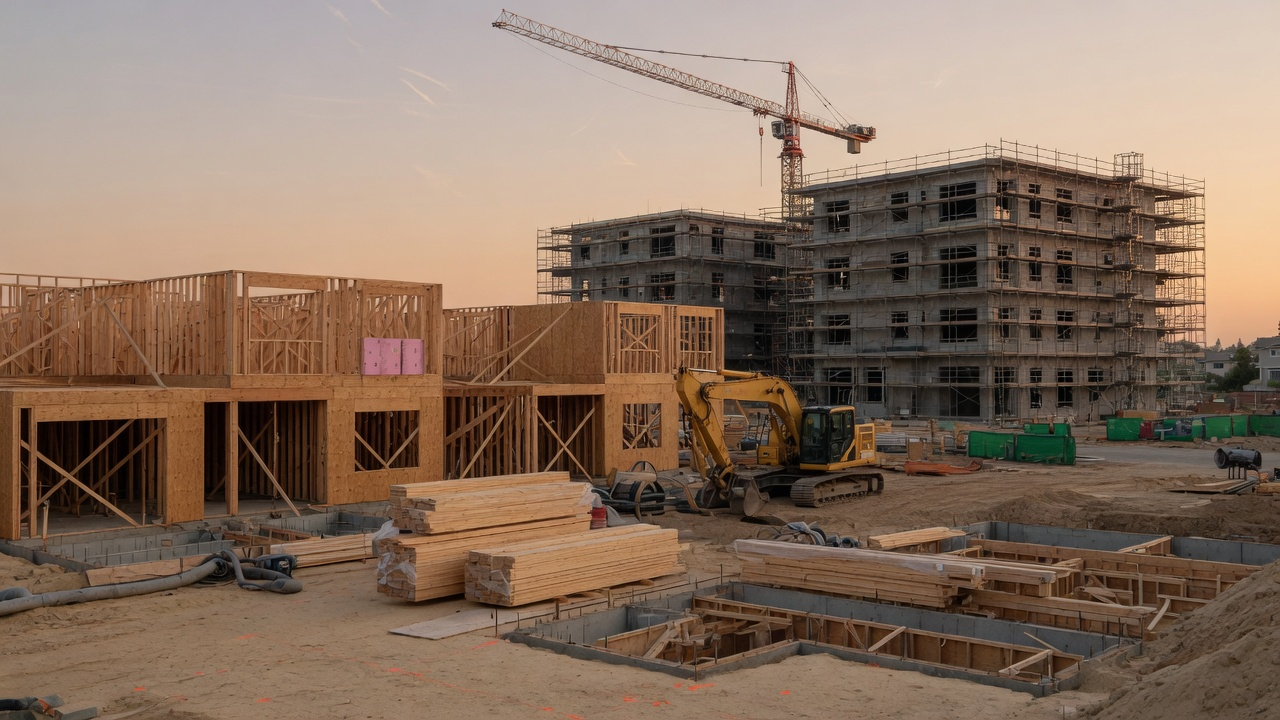
Housing starts count the number of new privately owned residential units where construction has physically begun in a given month. The U.S. Census Bureau publishes the figure monthly, working with the Department of Housing and Urban Development, as part of its New Residential Construction release. In July 2026, starts fell to 1,239,000 units at a seasonally adjusted annual rate, down 12.4% from June's revised 1,415,000 and down 13.5% year over year. That print is a useful worked example of how to read this indicator correctly, and where most people go wrong reading it.
What housing starts actually counts
Picture the Census release as a three-part relay race. Builders apply for permits first, then break ground (that's the start), and the unit is eventually finished and counted as a completion. Permits lead starts by roughly one to three months, which makes them the more forward-looking of the three series. Completions lag furthest behind, reflecting decisions made a year or more earlier.
All three figures come out as a seasonally adjusted annual rate. The Census Bureau takes the month's actual count, strips out predictable seasonal effects like winter weather slowdowns, and annualizes it. A monthly SAAR reading of 1.24 million doesn't mean 1.24 million homes broke ground in July. It means the pace of activity, if it held for twelve months, would produce that many.
Why it matters
Residential investment is a small slice of GDP, typically 3-5%, but it's also one of the most volatile, so swings here can move the quarterly growth headline by meaningful tenths. Construction activity feeds directly into employment for builders, electricians, and suppliers of lumber, concrete, and appliances. Housing is the most interest-rate-sensitive corner of the real economy, which makes this series a live test of whether Fed policy is actually loosening financial conditions where it counts, not just in asset prices.

How to read it
The July print is a case study in why the single-family and multifamily components need to be read apart, not together. Single-family starts came in at 808,000, the purer read on mortgage-rate-constrained household demand, since a family buying one home responds almost immediately to the Freddie Mac 30-year fixed rate. Multifamily starts held up relatively better at 421,000, but that series reflects a pipeline set in motion years ago, still working through the supply glut left over from the 2022-2023 apartment building boom. Treating a soft headline number as "housing is collapsing" without separating these two stories is the most common misread of this release. Month-to-month figures stay noisy even after seasonal adjustment, which is why most analysts lean on three-month averages or year-over-year comparisons instead of a single print.
Key takeaways
- Housing starts are SAAR figures: an annualized projection, not a monthly total.
- Permits lead starts, which lead completions; watch permits for the earliest signal.
- Single-family and multifamily starts respond to different forces and different time horizons.
- A double-digit decline like July's echoes the 2022-2023 mortgage-rate shock and suggests the sector is still absorbing the lagged effects of a multi-year restrictive-rate regime.
Main sources
- U.S. Census Bureau New Residential Construction
- Census Bureau New Residential Construction, July 2026 release
- FRED Housing Starts: Total (HOUST)
- FRED Single-Family Housing Starts (HOUST1F)
- BEA GDP release, residential fixed investment component
- NAHB/Wells Fargo Housing Market Index
- Freddie Mac Primary Mortgage Market Survey
Discussion