


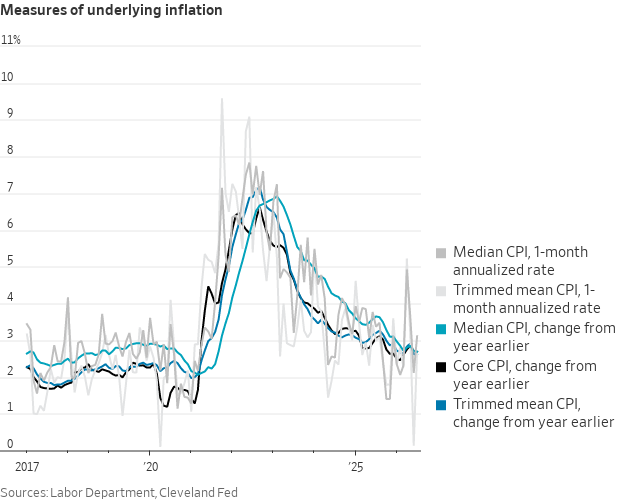
Every month, headline writers seize on one number from the Bureau of Labor Statistics (BLS): the Consumer Price Index (CPI). July's release showed headline CPI falling −0.4% month over month, with the year-over-year rate at 3.5%. Core CPI, which strips out food and energy, was flat on the month and up 2.6% year over year. Here's the part that rarely makes the headline: the Federal Reserve's actual 2% inflation target isn't written in CPI terms at all.
What is CPI
CPI tracks the average price change for a fixed basket of goods and services that a typical urban household buys: food, housing, apparel, transportation, medical care, recreation. Think of it as pricing the exact same shopping cart every month and watching the total bill move.
BLS collects roughly 80,000 prices monthly from retailers, service providers, and rental units across 75 urban areas, covering about 93% of the US population. The index is built against a 1982-84 base period set to 100, and it's a Laspeyres-type formula, meaning the basket's contents stay fixed even as consumers' actual habits shift.
Why it matters
CPI does more than lead the evening news. It drives cost-of-living adjustments for Social Security benefits, using a related index called CPI-W (the Consumer Price Index for Urban Wage Earners and Clerical Workers), and it's written into private contracts too, from leases to labor agreements. That gives it real economic teeth independent of anything the Fed does.
But the Fed's own mandate, spelled out in its Statement on Longer-Run Goals, is defined using the Personal Consumption Expenditures (PCE) price index published by the Bureau of Economic Analysis (BEA), not CPI. PCE typically runs 30 to 50 basis points below CPI, partly because it uses a chain-weighted formula that captures substitution (shoppers switching to chicken when beef gets expensive), and partly because its weights come from business receipts rather than consumer recall surveys. A 2.6% core CPI print is broadly consistent with core PCE closer to 2.0-2.3%, a materially smaller gap to the Fed's goalpost than the CPI headline implies.
How to interpret it
Shelter, meaning owners' equivalent rent plus primary rent, makes up roughly one-third of the CPI-U (the formal name for the headline urban-consumer index) basket, more than in PCE. That weighting is why CPI can run hotter or cooler than PCE for extended stretches depending on the housing cycle. So when a CPI print crosses your desk, check what shelter did before you read through to the Fed's actual reaction function.
The 1996 Boskin Commission found the pre-reform CPI overstated true inflation by about 1.1 percentage points a year, from substitution bias, quality-change bias, and new-outlet bias. That pushed BLS toward geometric-mean formulas in 1999 and the chained CPI-U in 2002, though the series most people quote still runs on the older fixed-basket method.
Key takeaways
- CPI and core CPI are the numbers markets and media react to first, but they aren't the Fed's targeted series
- The Fed targets core PCE, which typically reads 30-50 basis points below core CPI
- Shelter's outsized one-third weight in CPI is the biggest single driver of the CPI-PCE gap
- A hot CPI print doesn't automatically mean the Fed is further from target than it looks
Discussion