


What is core PCE
The core personal consumption expenditures (PCE) price index tracks how much prices changed for the goods and services U.S. households buy, with food and energy stripped out. The Bureau of Economic Analysis (BEA) publishes it monthly inside the Personal Income and Outlays report. In the August 2026 release, headline PCE rose 0.3% month over month and 3.4% year over year; core PCE rose 0.2% month over month and 3.0% year over year.
The Federal Open Market Committee (FOMC) targets headline PCE at 2.0% annually, a goal spelled out in its 2012 Statement on Longer-Run Goals. Core is the version policymakers actually watch month to month, since food and energy swing on supply shocks that rarely stick around.
BEA builds this index differently than the more familiar Consumer Price Index (CPI). It deflates national spending data with a chain-type Fisher formula, blending last period's spending basket with the current one and taking the geometric mean. Weights shift as consumers substitute between goods, so if beef gets expensive and shoppers switch to chicken, the index picks that up faster than a fixed basket would. It also counts spending CPI ignores, like employer-paid health insurance and Medicare-funded care, which pushes health care's weight up and housing's weight down relative to CPI.
Why it matters
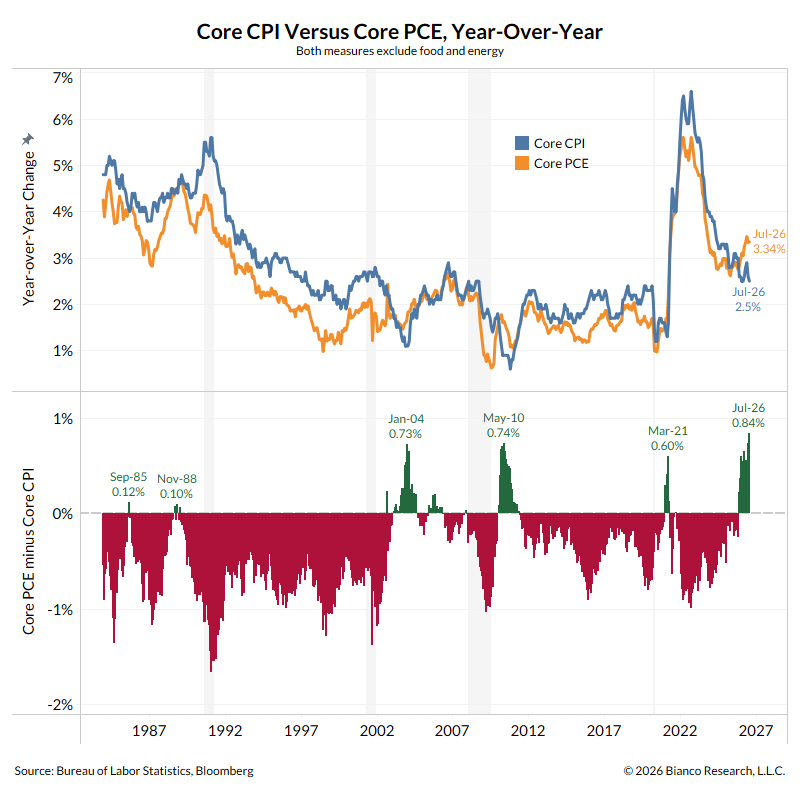
That is not a technicality. It is why core PCE has run roughly 20 to 40 basis points below CPI through most of the past two inflation cycles, including the 2021-2023 surge and the current disinflation. The Fed switched from CPI to PCE in 2000 under then-Chair Alan Greenspan because the chain-weighted formula tracks substitution and keeps pace with changing household budgets better than CPI's slower-updating basket.
Markets price Fed policy off PCE, not CPI. Fed funds futures and Treasury yields move on the PCE print, even though most financial media and nearly all consumers track their own cost of living through CPI, where shelter and auto insurance both carry heavier weight and have run hot relative to PCE's broader basket.
How to interpret it
Read the year-over-year core rate for the trend and the month-over-month rate for the latest impulse. A run of 0.2% monthly core gains annualizes near 2.4%, still above target. Headline and core diverging usually means an energy or food shock, and those tend to fade. Core staying elevated on its own points to services and other sticky categories doing the work. Pair the price data with real PCE growth in the same report: firm spending next to firm core inflation signals demand-driven pressure; soft spending next to sticky core prices points toward supply constraints instead.
Key takeaways
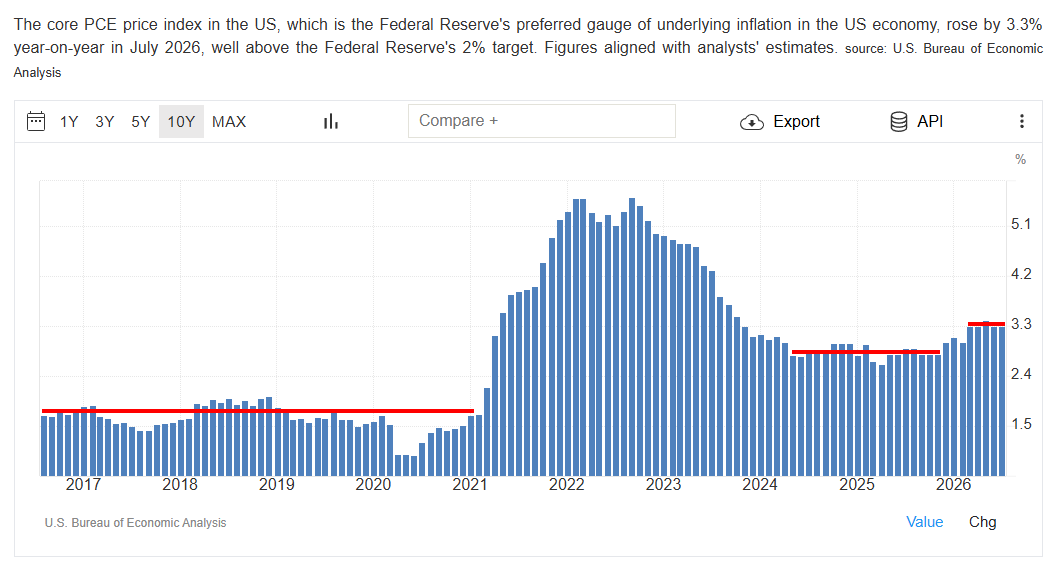
- Core PCE sits at 3.0% year over year as of August 2026, roughly halfway back to target from its February 2022 peak of 5.6%.
- The chain-weighted Fisher formula and PCE's broader, health-care-heavy scope are why the Fed's preferred gauge runs persistently cooler than CPI.
- Because PCE assumes faster consumer substitution and downweights housing, the official 2% target can tolerate a cost-of-living path that feels higher than 2% to households watching their own grocery and rent bills.
Main Sources
- Personal Income and Outlays, August 2026 (BEA)
- PCE Price Index Excluding Food and Energy (BEA)
- Statement on Longer-Run Goals and Monetary Policy Strategy (Federal Reserve)
- Why does the Federal Reserve aim for 2 percent inflation? (Federal Reserve FAQ)
- BLS Consumer Price Index
- BEA Prices & Inflation Learning Center
Listen to this article
Prefer audio? The full piece, read aloud.
Discussion