


What is nonfarm payrolls
Nonfarm payrolls is the monthly tally of paid jobs across the United States economy, excluding farm workers, private household employees, and a handful of nonprofit and government categories. The Bureau of Labor Statistics (BLS) produces the number through its Current Employment Statistics (CES) survey, which polls roughly 119,000 businesses and government agencies covering about 629,000 worksites. Each respondent reports headcount for the pay period that includes the 12th of the month, and BLS seasonally adjusts the result before later reconciling it against unemployment insurance tax records, a far more complete dataset that arrives with a lag.
Think of CES as a large, fast survey and the eventual benchmark revision as the slow, thorough audit. The survey gets the headline out quickly; the audit gets it right. That gap matters: the early 2024 benchmark revision, per BLS, cut a full year of payroll growth by roughly 818,000 jobs, the largest downward adjustment since the 2009 recession. Every fresh monthly print, including June's, is provisional until that reconciliation happens.
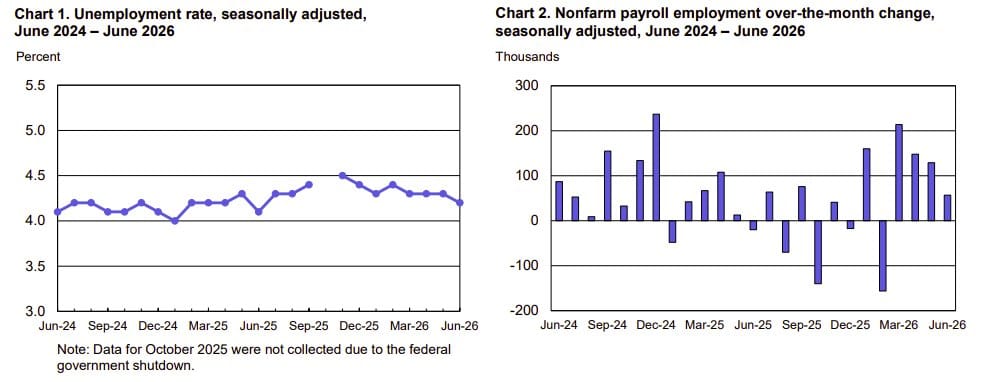
The unemployment rate that accompanies payrolls comes from an entirely separate source: the Current Population Survey (CPS), a household survey run jointly with the Census Bureau covering about 60,000 households. Because CES counts jobs and CPS counts people, the two series can diverge in the same month, and June 2026 is a textbook case.
Why it matters
Employment income drives consumer spending, which makes up roughly two-thirds of gross domestic product (GDP). The Federal Reserve tracks payrolls closely because its dual mandate requires balancing labor market strength against inflation, and a cooling jobs market shifts the calculus toward rate cuts, all else equal.
Payrolls rose just 57,000 in June 2026, well short of the 115,000 consensus and down from a downwardly revised 129,000 in May, per BLS. Yet the unemployment rate fell to 4.2%, better than the 4.3% forecast. The disconnect traces to the labor force participation rate, which dropped to 61.5%, its lowest since March 2021. Fewer people looking for work, not more people finding it, pulled the jobless rate down. Leisure and hospitality shed 61,000 jobs while professional services, healthcare, and social assistance posted modest gains.
How to interpret it
The headline print isn't what matters here. What matters is the "breakeven" rate: the pace of job growth needed just to hold the unemployment rate steady given underlying population and labor force growth. Dallas Fed research put breakeven near 250,000 a month in 2023, when post-pandemic immigration was surging. With net immigration slowing sharply since, Kansas City Fed and St. Louis Fed research puts breakeven closer to zero, and briefly negative, by late 2025.
That reframes the June print. A 57,000 gain would have flashed recession warning lights in 2019, when breakeven ran 100,000-150,000. Against a near-zero breakeven bar in 2026, the same number sits closer to trend growth than to labor market distress, even though it missed Wall Street's consensus estimate.
Key takeaways
- Nonfarm payrolls and the unemployment rate come from two different surveys and can tell conflicting stories in the same report.
- Grade the headline number against the current breakeven rate, not a fixed historical threshold; that bar has moved sharply since 2023 as immigration-driven labor force growth has slowed.
- Treat every initial print as provisional. Annual benchmark revisions have swung by hundreds of thousands of jobs in recent years.
- A falling unemployment rate driven by shrinking participation is a different signal than one driven by stronger hiring, and markets tend to read the former as the weaker outcome.
Main sources
- BLS Employment Situation Summary, June 2026
- BLS Current Employment Statistics (CES) methodology
- FRED Nonfarm Payrolls series (PAYEMS)
- Federal Reserve FEDS Notes: Labor force growth, breakeven employment, and potential GDP growth
- St. Louis Fed: Breakeven employment growth estimate range widens in 2026
- Kansas City Fed: Declining immigration, aging population reducing breakeven employment growth
Discussion