


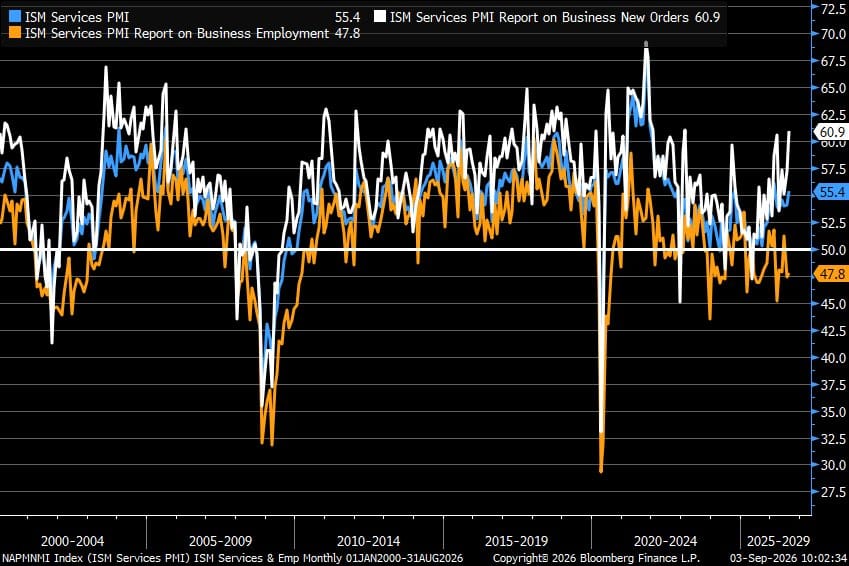
The Institute for Supply Management (ISM) Services Purchasing Managers' Index (PMI) rose to 55.4 in August, up from 54.1 in July, the 26th straight month above the 50 expansion line. Read only as a headline, that number says the US services economy is growing, comfortably. Read one layer down, it says something messier: activity is accelerating, hiring is contracting, and input prices just hit a four-year high.
What is the ISM services PMI
Built monthly from a survey of purchasing and supply executives across private services, construction, mining, and public administration, and weighted by each industry's contribution to GDP, the ISM services PMI is a diffusion index. It does not measure output level or growth rate. It measures breadth: what share of surveyed firms reported conditions better, the same, or worse than the prior month.
For each component, the math is mechanical: percentage reporting improvement, plus half the percentage reporting no change. A reading of 50 means as many firms saw deterioration as improvement. The headline composite averages four subindexes at 25% each: Business Activity, New Orders, Employment, and Supplier Deliveries (the last inverted, since slower deliveries signal tight supply, not weak demand). A Prices index is tracked but excluded from the headline math entirely.
Originally launched in 1997 as the Non-Manufacturing Index and renamed in 2020, the series is released at 10:00 a.m. ET on the third business day of each month for the prior month, via the ISM services PMI report.
Why it matters
Private services accounted for 73.1% of US GDP in Q1 2026, according to Bureau of Economic Analysis (BEA) data, dwarfing the slice covered by the manufacturing PMI. That makes the services print the earliest broad qualitative map of the economy, arriving weeks ahead of official GDP.
How to interpret it
Think of the headline as a weather map showing how many cities warmed, not by how many degrees. The useful information sits in the subindexes, not the average that washes them together.
In August: Business Activity jumped to 61.7 and New Orders to 60.9, both strong. Employment held at 47.8, contraction for a second straight month. Prices, excluded from the composite, surged to 72.6, the highest since 2022. That combination, expanding demand, shrinking headcount, accelerating input costs, is not a contradiction the headline resolves. It is the same tension the ADP National Employment Report, a private-sector payrolls survey, flagged on September 2, when private payrolls added just 38,000 jobs, the slowest pace since January.
This is the dataset the Federal Reserve is arguing over this month: a labor market showing real cracks against services-sector cost pressure that has not gone away. Anyone trading the headline number alone is trading half the report.
Discussion