


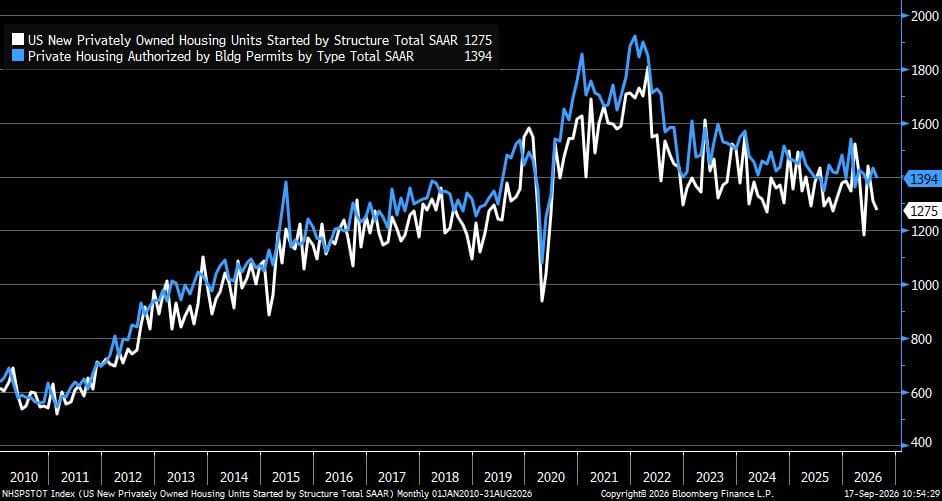
What are housing starts
Housing starts count the new privately owned homes where builders broke ground that month. The U.S. Census Bureau and the U.S. Department of Housing and Urban Development (HUD) publish the number jointly, once a month, in the New Residential Construction release. A unit is officially "started" the moment excavation begins for a footing or foundation, not when a permit clears, and not when the keys change hands.
The housing pipeline has three checkpoints on the same road. A permit is the license: authorization to build, nothing on the ground yet. A start is the car pulling out of the driveway: dirt is moving. A completion is arrival: the unit is finished and ready to occupy. All three show up in the same monthly report. Read only one and you're judging the whole trip off a single mile marker.
The numbers come from the Survey of Construction, which samples roughly 900 permit-issuing jurisdictions and tracks a subset of actual permits to confirm when ground actually breaks, plus a smaller survey covering areas with no permit requirement at all. Manufactured (HUD-code) homes, public housing, and conversions of existing buildings don't make the count.
Why it matters
Housing reacts to interest rates faster than almost anything else in the economy. A 30-year mortgage rate that jumps from 4% to 7% prices out buyers within months, long before that shows up in retail sales or payrolls. Edward Leamer made the case directly: his National Bureau of Economic Research (NBER) paper, "Housing IS the Business Cycle", credits residential investment with foreshadowing eight of the last ten postwar recessions. It's why starts function as a leading indicator rather than a coincident one. The sector feels tighter credit first, and construction spending flows straight into GDP and employment across lumber, appliances, and the building trades.

How to interpret it
The headline figure is a seasonally adjusted annual rate (SAAR): take the seasonally adjusted monthly count and multiply by 12, so a single month's pace lines up against annual totals. It describes that month's rate of ground-breaking. Nothing more, and definitely not a forecast for the year ahead.
Because the survey is a sample and multifamily projects move in large blocks, month-to-month swings get noisy. That's exactly why the Census Bureau publishes wide confidence intervals on its percent changes. Read starts alongside permits (the pipeline) and completions (the delivery), and always split single-family from multifamily. The two segments answer to different buyers. Single-family depends on owner-occupants who need a home regardless of what financing costs; multifamily leans on construction lending and investor return hurdles. Single-family rising while multifamily stalls is a different demand backdrop than a broad advance, or a broad decline.
Discussion