


What is the advance GDP estimate
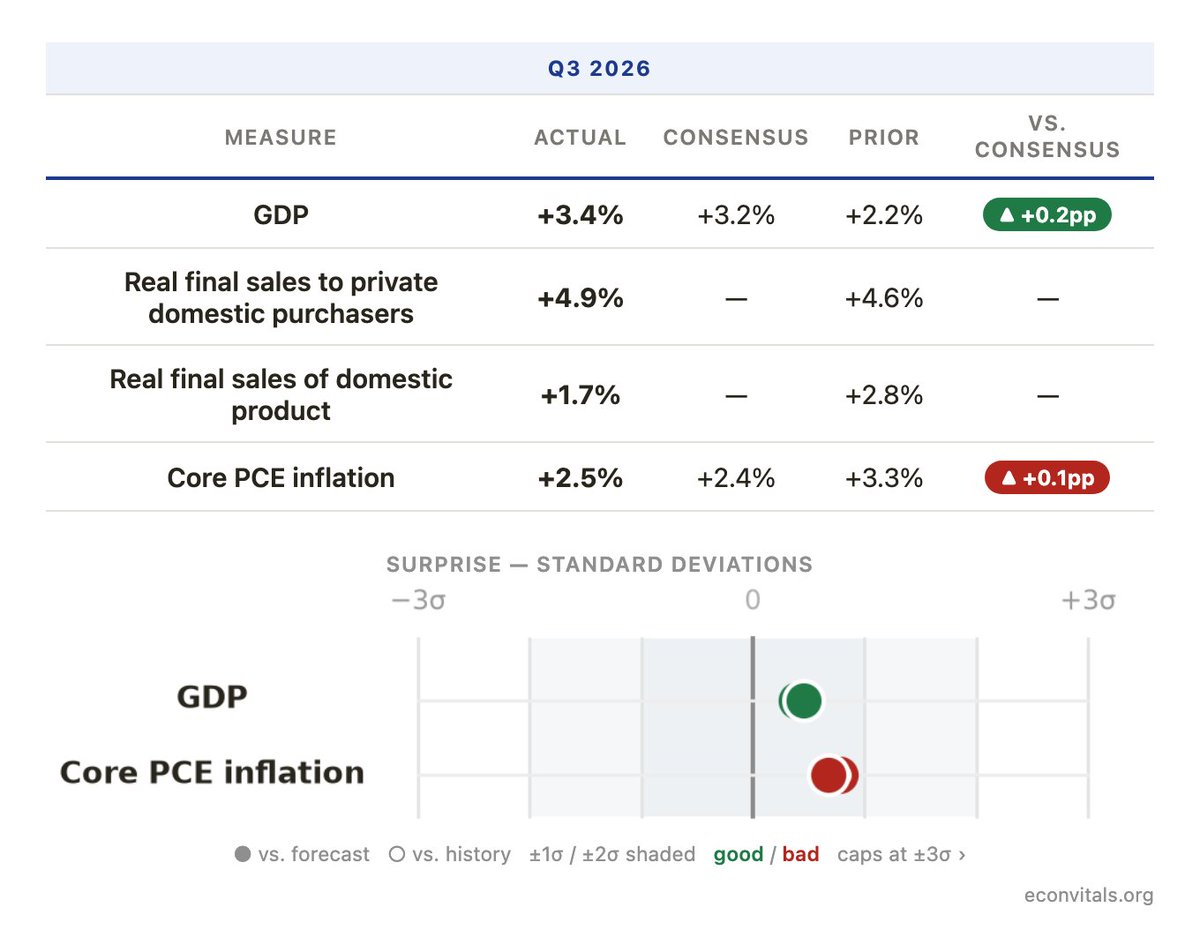
Gross domestic product (GDP) is the value of final goods and services produced inside the United States. The Bureau of Economic Analysis (BEA) publishes its first read about a month after each quarter ends. For Q3 2026, the advance estimate had real growth at 3.4% annualized, after 2.2% in Q2.
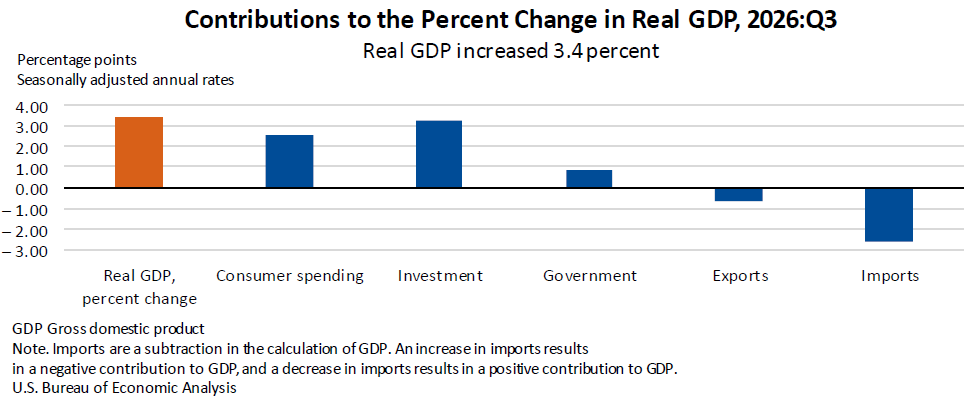
The headline adds consumer spending, private investment, government spending and exports, then subtracts imports. The subtraction is there because the first three already include purchases from abroad. Real GDP strips out price changes using a chain-type index, which resets its weights as relative prices shift.
Why it matters
The advance estimate is a first draft, written before all the sources are in. BEA fills the gaps with assumptions tied to Census Bureau, Bureau of Labor Statistics and trade data, then swaps in actual figures as they arrive. The second estimate, due November 25, adds corporate profits and more source data.
Drafts get edited. BEA's own revision studies put the mean absolute revision from the advance figure to the latest estimate at roughly 1.2 to 1.3 percentage points. Q4 2008 was first reported near −3.8% and ended close to −8%. Set against a 3.4% headline, that margin is wide.
How to interpret it
One result, two units. The 3.4% annual rate and the 0.8% quarterly change are the same number. The quarterly change is 0.84% before rounding; compound it over four quarters and you get 1.0084⁴, about 1.034. Annualizing is like reading a speedometer. It shows the pace if the quarter's speed held for a year, which magnifies one quarter's noise roughly fourfold.
Look past the headline. Real final sales to private domestic purchasers rose 4.9% annualized, up from 4.6% in Q2. The measure adds consumer spending and private fixed investment and leaves out inventories, government and net exports, the most volatile pieces. This quarter's investment gain came mainly from private inventories and equipment, led by information processing equipment. A stock build adds to GDP without saying much about demand. And imported equipment counts in investment, then comes back out through the import line.
Match the window to the claim. The Q3 personal consumption expenditures (PCE) price index rose 2.1% annualized, or 2.5% excluding food and energy. The September monthly report showed PCE prices 3.6% above a year earlier, or 3.1% core. A quarterly annualized rate captures recent momentum; a year-over-year rate carries older months and base effects. Neither is wrong. They answer different questions.
Nominal GDP grew 5.6% annualized against 3.4% real growth, which implies a price deflator near 2.1%. That is back-of-envelope arithmetic, not BEA's published deflator.
Key takeaways
- The 3.4% headline and the 0.8% quarterly change are one fact in two units.
- Read the composition. Private final sales, inventories and net exports can tell different stories inside one total.
- Treat the advance figure as provisional. Revisions of a full point in either direction are common.
- Watch November 25 for changes to inventories and equipment, the softer parts of the headline.
Main sources
- BEA, GDP (Advance Estimate), 3rd Quarter 2026
- BEA, Personal Income and Outlays, September 2026
- BEA Glossary, Gross Domestic Product
- BEA FAQ, why quarterly changes are published at annual rates
- BEA, The Expenditures Approach to Measuring GDP
Listen to this article
Prefer audio? The full piece, read aloud.
Discussion