


What is the trade balance
Form FT-900 is the paperwork behind the US International Trade in Goods and Services report, which measures the difference between what the United States sells abroad and what it buys from abroad each month. Exports minus imports equals the balance. A negative number is a deficit, a positive one a surplus, and the US has run a deficit every year since 1975.
Census and the Bureau of Economic Analysis (BEA) publish the report jointly. Census pulls the goods side straight from customs paperwork; essentially every shipping container and cargo manifest crossing a border gets logged. Services are harder to track: tourism spending, software licensing, consulting fees, none of it passes through a customs checkpoint, so the BEA estimates that side from surveys and administrative records.
The May 2026 release, published July 7, showed the deficit widening to $77.6bn, up from a revised $54.6bn in April, a $23.0bn jump in a single month. Exports fell to $317.7bn; imports rose to $395.3bn.
Why it matters
Net exports are a direct line item in the GDP identity: GDP = consumption + investment + government spending + (exports minus imports). When the trade gap widens, it mechanically subtracts from growth, all else equal. That is why economists watch this release on the same day trackers like the Atlanta Fed's GDPNow, a real-time GDP growth estimate updated from incoming data, recalculate their quarterly estimate.
The trade balance also ties into the "twin deficits" story. A wider trade gap alongside a large federal budget deficit means the country is leaning more heavily on foreign capital to fund the shortfall, which has implications for Treasury demand and, at the margin, the dollar.
How to interpret it
Separating trend from noise is the real discipline with this series, and May proves it. Context beats the headline print every time.
The deficit hit a record −$135.9bn in March 2025 as importers front-ran that April's tariff announcements, pulling forward purchases before new duties took effect. That distortion unwound through the rest of 2025 into 2026, dragging the deficit down to April's multi-year low of $54.6bn. Year-to-date 2026 versus 2025, the deficit is still down 40.6%.
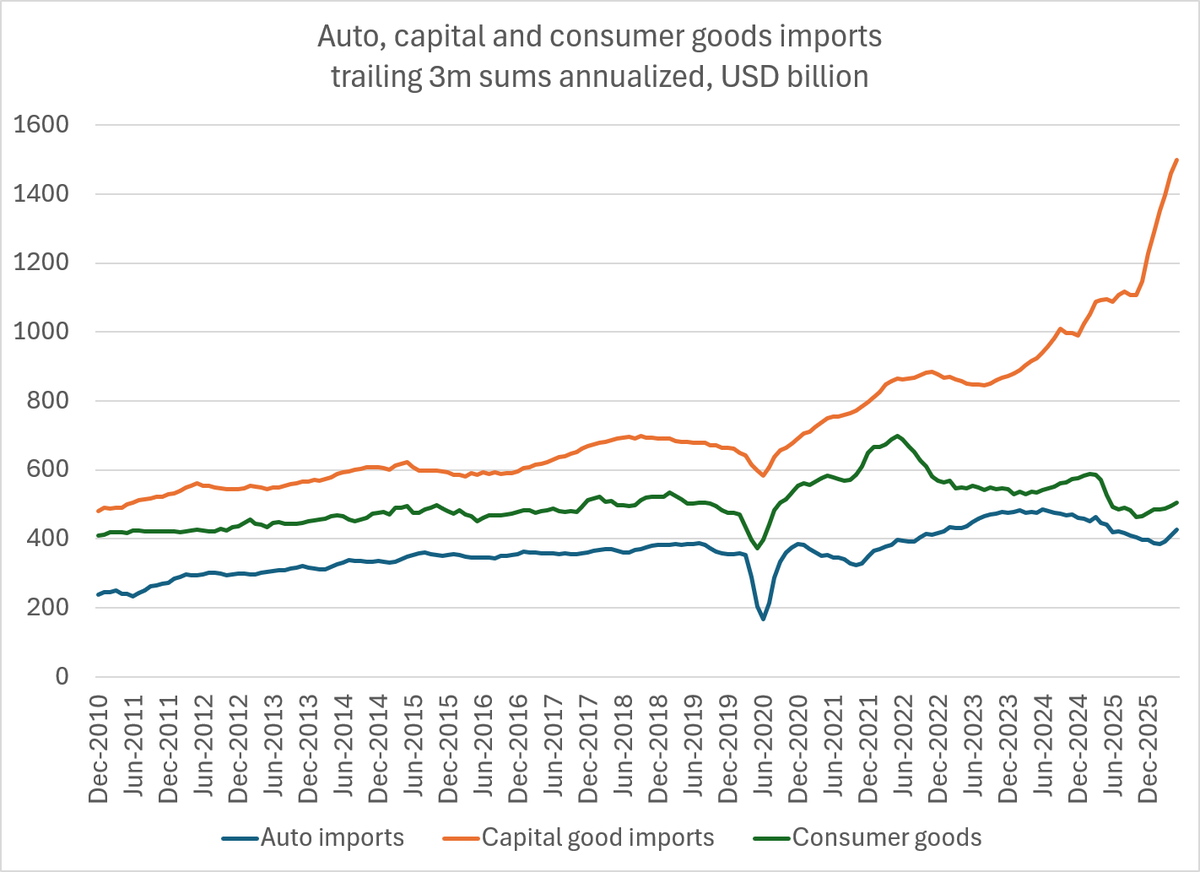
May's jump looks less like a fresh crisis and more like the mirror image of that unwind: a possible restocking cycle. The same categories that drove the 2025 front-running, pharmaceuticals and cell phones, are now driving the import surge again, alongside crude oil and passenger cars. Exports weakened partly on falling gold shipments, which reflects idiosyncratic bullion-flow timing rather than a demand story.
Split goods from services in every release. The goods balance (a $106.5bn deficit in May) responds to exchange rates, tariffs, and domestic demand cycles. The services balance (a $28.9bn surplus) tends to be steadier, driven by exports like US software and financial services.
Key takeaways
- One month rarely confirms a trend. Wait for June and July prints before concluding whether import-substitution from tariffs is fading or businesses are rebuilding depleted inventories.
- Always check the revision to the prior month. April's deficit was revised, and the "$23bn widening" is measured against that revised base, not the originally reported figure.
- Watch which categories move. Pharma and electronics import strength feeds directly into core Personal Consumption Expenditures (PCE) goods inflation and matters more for the Fed's inflation read than for GDP alone.
Discussion