


What are housing starts
The Census Bureau counts a housing start when construction begins on a new, privately owned housing unit, which it dates to excavation for the footings or foundation. A building with several units counts all of them at once, so one large apartment project can move the total.
The Census Bureau and the Department of Housing and Urban Development (HUD) publish the figures in the monthly New Residential Construction report. It covers site-built and modular homes. Manufactured housing is measured separately.
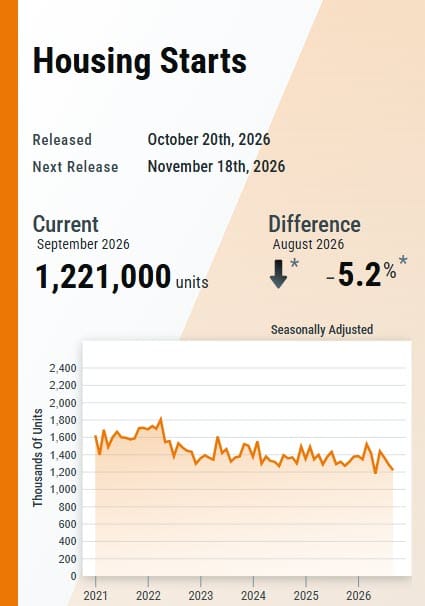
September starts came in at a seasonally adjusted annual rate of 1.221 million, a −5.2% change from a revised 1.288 million in August.
Why it matters
Starts feed residential fixed investment, the part of GDP that the Bureau of Economic Analysis tracks as spending on new homes and major improvements. It is a small share of output, but it swings enough to move quarterly growth. It is also among the most rate-sensitive parts of the economy, which makes it the place to watch mortgage costs reach builders.
Housing works as a three-stage pipeline. Permits come first (1.400 million), then starts (1.221 million), then completions (1.192 million). Each stage comes from a different survey with its own error. Permits are the steadiest, and the Conference Board includes them in its Leading Economic Index.
How to interpret it
Starts come from a sample, not a census. The Survey of Construction draws roughly 1 in 50 permits for one-to-four-unit buildings from about 900 permit offices, then scales the results up to the full permit totals. Think of polling a small group of builders and extrapolating to the whole industry.
That is why Census prints a 90% confidence interval and flags insignificant changes with an asterisk. September's −5.2% came with a margin of ±11.8 percentage points, so the plausible range runs from about −17.0% to +6.6%. The data cannot say whether starts rose or fell. The year-over-year change of −7.4% (±11.5 points) has the same problem. Single-family starts of 859,000 fell 4.6% from August, also inside the margin.
Only completions delivered a statistically clear move, down 14.0% from a year earlier (±11.1 points). They reflect projects begun many months ago, so they show what builders did then, not what they plan now.
Two more cautions. First prints get revised as late builder reports arrive, and the August figure here is already a revision. Seasonal adjustment strips out the normal winter slowdown but not unusual weather.
Zoom out and the single month shrinks. According to FRED, starts peaked near 2.27 million in January 2006 and bottomed near 478,000 in April 2009. The current pace sits roughly mid-range for the post-crisis recovery.

Key takeaways
- Look for the asterisk first. A headline percent change inside its margin of error is not a trend.
- Then check permits. They are less noisy, and September's 1.400 million was almost flat on the month (−0.2%).
- Trust the three-month average over any single print, and expect revisions.
- Single-family starts track homebuying. Buildings with five or more units (349,000) track rental construction and swing more.
- October's report is the test. Permits below roughly 1.35 million, or a single-family decline outside its interval, would be the first real confirmation that weak demand is reaching builders.
Main sources
- New Residential Construction, U.S. Census Bureau and HUD
- Survey of Construction methodology, U.S. Census Bureau
- Building Permits Survey definitions, U.S. Census Bureau
- New Residential Construction release FAQs, U.S. Census Bureau
- Gross Domestic Product, U.S. Bureau of Economic Analysis
- US Leading Indicators, The Conference Board
- Housing Starts (HOUST), FRED
Listen to this article
Prefer audio? The full piece, read aloud.
Discussion