


What is advance retail sales
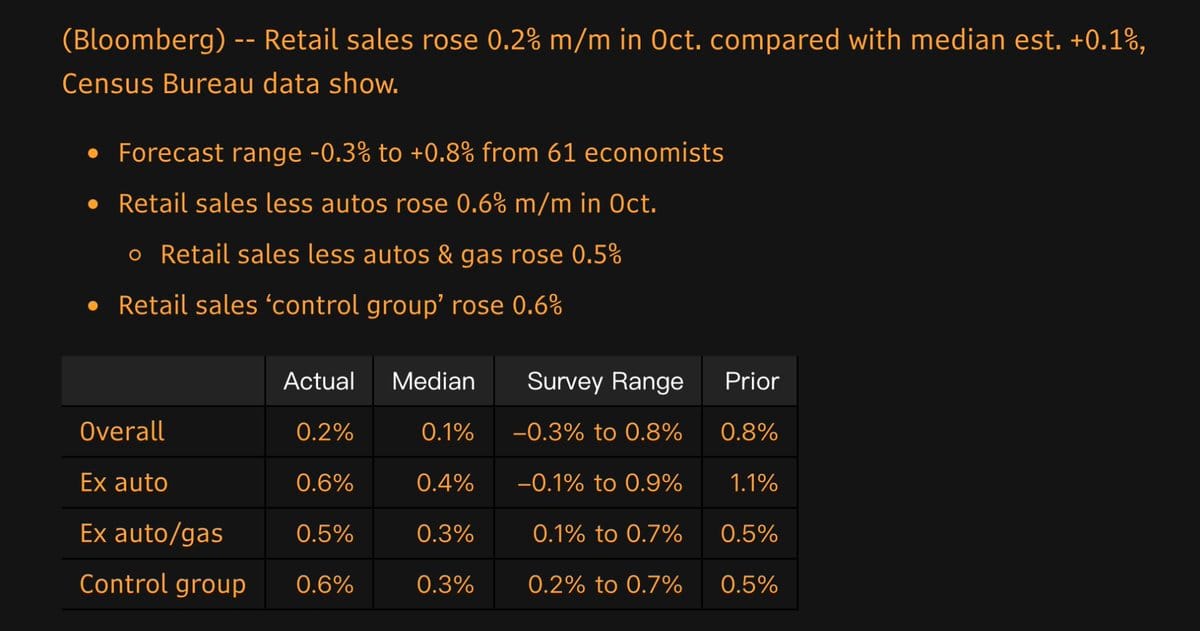
The advance retail sales report is the U.S. Census Bureau's first official count of what retailers, online sellers and restaurants took in the previous month. It covers North American Industry Classification System (NAICS) sectors 44 and 45, plus food services and drinking places. October 2026 came in at $748.2bn, up 0.2% from September and 6.8% from a year earlier.
The series is in current dollars. Census adjusts it for seasons, holidays and trading days but not for prices, counts sales net of refunds, and leaves out sales tax, per the Census definitions.
Why it matters
The Bureau of Economic Analysis (BEA) feeds retail sales into its estimate of consumer spending in GDP, and the Fed watches it too.
Coverage is narrower than the headline suggests. Services made up 69% of personal consumption expenditures (PCE) in Q3 2026 and goods 31%, according to BEA Table 2.3.5. Retail sales mostly track the goods slice.
How to interpret it
Think of the headline as a bathroom scale that is only accurate to a few ounces: it is an estimate from a sample. Census surveys about 4,800 firms and links each month to the last, and it publishes a 90% margin of error beside every figure.
October's +0.2% comes with a margin of ±0.4 percentage points, which puts the interval at −0.2% to +0.6%. Zero sits inside it. Census flags figures like this with an asterisk, meaning the evidence is not strong enough to say the change differs from zero.
Revisions say the same thing. Census states that the average absolute revision to the advance estimate is 0.2 points, as large as October's headline.
The 6.8% year-on-year gain (±0.5) is statistically solid, but it is nominal. Two categories show how far price and volume can diverge:
- Gasoline stations: +1.5% on the month and +30.3% on the year. A higher pump price lifts this category even when drivers buy the same fuel.
- Nonstore retailers: +1.2% on the month and +11.8% on the year. No single commodity price drives this category, so it is closer to a read on shifting volume.
The mix tells a different story from the headline. Excluding motor vehicle and parts dealers, sales rose 0.6% to $611.2bn, while dealer sales fell 1.6%. Autos pulled the total down and hid firmer spending elsewhere.
Three checks for any print:
- Check for the asterisk.
- Compare the monthly change with the 0.2-point average revision.
- Separate price-driven categories from volume-driven ones.
Key takeaways
- Advance sales are nominal receipts, so price changes are baked in.
- An asterisk means the 90% interval includes zero. October's +0.2% cannot be told apart from a small decline.
- Year-on-year changes are large relative to their margin of error, but a 30% gasoline jump inflates them.
- The test is the next release. If October is revised by more than 0.2 points or flips sign, the asterisk was the real story. If September's +0.8% (±0.2), unchanged in the October release, survives its next revision, the consumer is firmer than one noisy print suggests.
Main sources
- Advance Monthly Sales for Retail and Food Services, October 2026 (CB26-181), U.S. Census Bureau
- About the Advance Monthly Retail Trade Survey, U.S. Census Bureau
- Monthly retail trade definitions, U.S. Census Bureau
- Advance Retail Sales (RSAFS), Federal Reserve Bank of St. Louis
- Seasonally adjusted sales by kind of business, October 2026, FRED
- Table 2.3.5. Personal Consumption Expenditures by Major Type of Product, BEA via FRED
Listen to this article
Prefer audio? The full piece, read aloud.
Discussion