


What is the PPI
The Producer Price Index measures the average change in selling prices that domestic producers receive for their output, covering goods, services, and construction at the first point of commercial transaction. The Bureau of Labor Statistics (BLS) publishes it monthly. What it captures is what producers get paid, not what consumers eventually pay, and that distinction is the source of the index's analytical value.
Each month the BLS collects roughly 100,000 price quotations from more than 25,000 producer establishments. Those data feed into the Final Demand-Intermediate Demand (FD-ID) system, a framework introduced in January 2014 to replace the legacy "Finished Goods" headline index. The switch mattered: services and construction entered the headline measure for the first time, giving the index a proper grip on an economy that had long since moved beyond manufactured goods.
Price aggregation uses a modified Laspeyres formula, comparing current prices against a reference period with production weights fixed at a base date. That fixed-weight structure has interpretive consequences, discussed below.
Why it matters
The PPI's analytical edge is timing. CPI registers inflationary pressure when it reaches the consumer. PPI catches it earlier, at the producer level, before retail markup and distribution costs obscure the signal. By the time a cost shock shows up at checkout, it has typically been building for months.
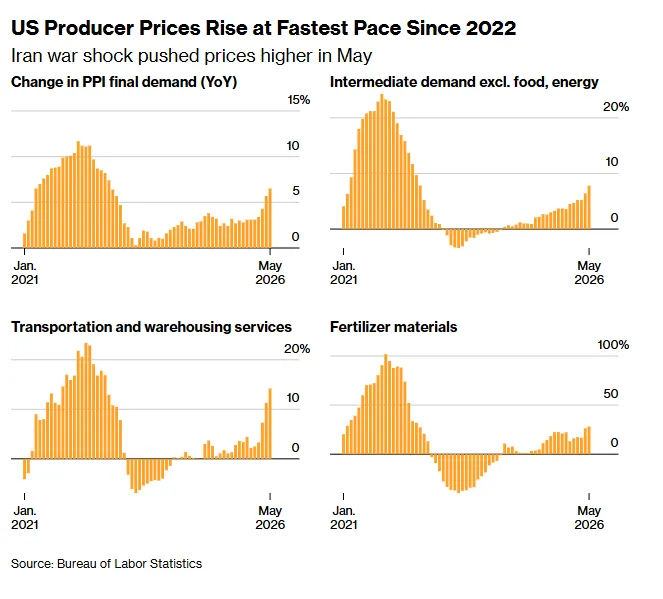
The May 2026 BLS release puts a number on that lag. Final demand PPI rose +1.1% month-over-month on a seasonally adjusted basis, with goods prices up +2.8% against a modest +0.3% gain in services. The 12-month reading came in at +6.5%, a level not seen since early 2022, when PPI peaked near +11.7% year-on-year in March before supply-chain normalization in 2023 briefly pushed it negative.
A 2.8% goods shock does not stay at the factory gate. It travels through intermediate demand tiers before arriving at the retail shelf, typically within one to three months. The Federal Reserve uses PPI data as an early read on CPI trajectory; businesses use it to benchmark price-escalation clauses in long-term contracts.
How to interpret it
Several traps await casual readers.
Goods vs. services divergence. Large monthly moves in goods almost always trace back to commodity price swings, energy spikes, or tariff pass-through. Services moves are stickier and harder to reverse. When goods drive a surge, as in May 2026, the question is whether it is a one-time cost shock or the start of a sustained re-pricing cycle.
Core vs. headline. Pull food and energy out and you get a core reading that tracks underlying trend more reliably than the volatile headline. When goods prices swing hard in either direction, the core series is the one to watch.
The base-weight problem. The modified Laspeyres formula uses fixed shipment weights from a base period. When production mixes shift rapidly, as during commodity shocks or tariff-driven substitution, those fixed weights can overstate or understate actual cost pressure. A tariff-affected category carries the same index weight it had before the tariff existed; if producers have reallocated output since the base period, the headline reading may be misleading.
PPI-CPI spread. When PPI runs well ahead of CPI, producers or retailers typically absorb the gap as margin compression. The pressure shows up in earnings before it reaches consumer prices, which makes the spread a useful leading indicator for industrial and consumer-staples equity margins.
Key takeaways
- PPI measures upstream price changes at the producer level, excluding retail markups, distribution costs, and taxes
- The FD-ID framework covers goods, services, and construction; the legacy Finished Goods headline missed the services economy entirely
- May 2026's print (+6.5% YoY, +2.8% goods MoM) marks a sharp reversal of the 2023 disinflation, comparable in magnitude to the 2022 inflation peak
- PPI typically leads CPI by one to six months as costs work through the supply chain; rising producer costs compress margins before reaching consumer prices
- Fixed base-period weights in the Laspeyres formula can distort the headline when production mixes shift rapidly; always cross-reference against core PPI and intermediate demand sub-indexes
Main sources
- BLS Producer Price Index home
- BLS PPI news release, May 2026
- BLS Handbook of Methods: PPI calculation
- BLS Consumer Price Index (for PPI-CPI transmission comparison)
- Federal Reserve Beige Book (qualitative corroboration of cost pass-through)
Discussion