


What is Personal Income and Outlays?
The Bureau of Economic Analysis (BEA) releases its Personal Income and Outlays report monthly, typically at month-end, covering the prior month's household finances. The report tracks four variables:
- Personal income: wages, salaries, proprietors' earnings, rental income, dividends, interest, and government transfer payments
- Disposable personal income (DPI): after-tax income, the amount households have available to spend or save
- Personal Consumption Expenditures (PCE): total household spending on goods and services, the broadest measure of consumer demand
- Personal saving rate: savings as a share of DPI, a real-time gauge of household resilience
The BEA releases the PCE Price Index alongside the spending data. The Federal Reserve uses it as its primary inflation benchmark rather than CPI because it covers a broader consumption basket and accounts for consumer substitution. The Fed's target is 2% annually.
Why it matters
Consumer spending drives roughly two-thirds of U.S. GDP. When PCE rises, businesses invest and hire; when it contracts, the effect moves through supply chains and labor markets.
The PCE Price Index is what makes this report a market mover. Each monthly print moves rate expectations, Treasury yields, and equity valuations. A surprise to the upside can reprice rate-cut timelines almost instantaneously.
The saving rate is the forward-looking piece. A household saving more is building a buffer against future shocks. One saving less is financing current consumption by drawing down reserves, which only works for so long.
How to interpret it: April 2026 as a live worked example
The April 2026 BEA release is worth walking through in sequence. The picture that forms is uncomfortable.
Personal income rose less than +0.1%, well below the expected +0.3%. Wages dominate this component, so near-flat income growth signals labor market cooling. DPI turned negative at -0.1% (-$19.9 billion): taxes and transfers were a net drag on what households actually had in hand.
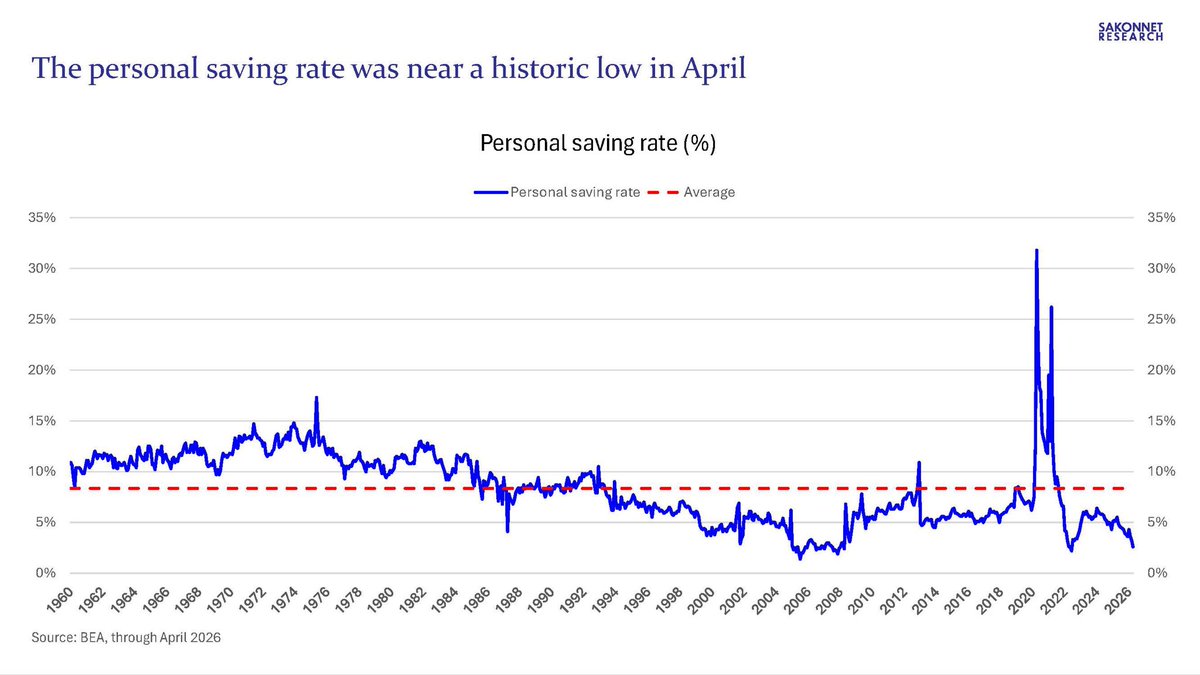
Yet PCE rose +0.5% (+$111.1 billion), right on forecast. Households spent more than they earned. Something filled that gap: the personal saving rate fell to 2.6%, down from 3.2% in March. That is where the spending came from, a savings drawdown rather than a wage gain.
The long-run U.S. saving rate averages roughly 8.4% since 1959, per Federal Reserve Economic Data (FRED). Even at the depth of the pre-2008 consumer credit boom, it rarely stayed below 3% for any sustained period; the 2005-2007 trough was the warning that preceded the financial crisis. At 2.6%, there is little margin for error.
Then there's the inflation side. Headline PCE accelerated to +3.8% YoY, its highest since May 2023, while core PCE reached +3.3% YoY, its highest since October 2023. Both matched forecasts, but the direction matters more than the miss: roughly 18 months of disinflation progress have now fully reversed.
Core PCE sits 130 basis points above the Fed's target while the consumer is financing spending through savings rather than income growth. The Federal Reserve cannot cut rates without risking further inflation entrenchment, yet tightening further risks breaking a consumer whose financial cushion is already thin.
Key takeaways
- When PCE grows faster than personal income, the saving rate absorbs the difference. That is sustainable only for so long.
- Markets trade on CPI headlines, but monetary policy runs on core PCE. At +3.3% YoY, there is no near-term case for rate cuts.
- At 2.6%, the household buffer is thin. A further income shock has limited savings to absorb it.
- Core PCE MoM came in at +0.2% (vs. forecast +0.3%), softer than the annual trend implies. Watch whether monthly momentum decelerates before drawing conclusions about the YoY trajectory.
Discussion