


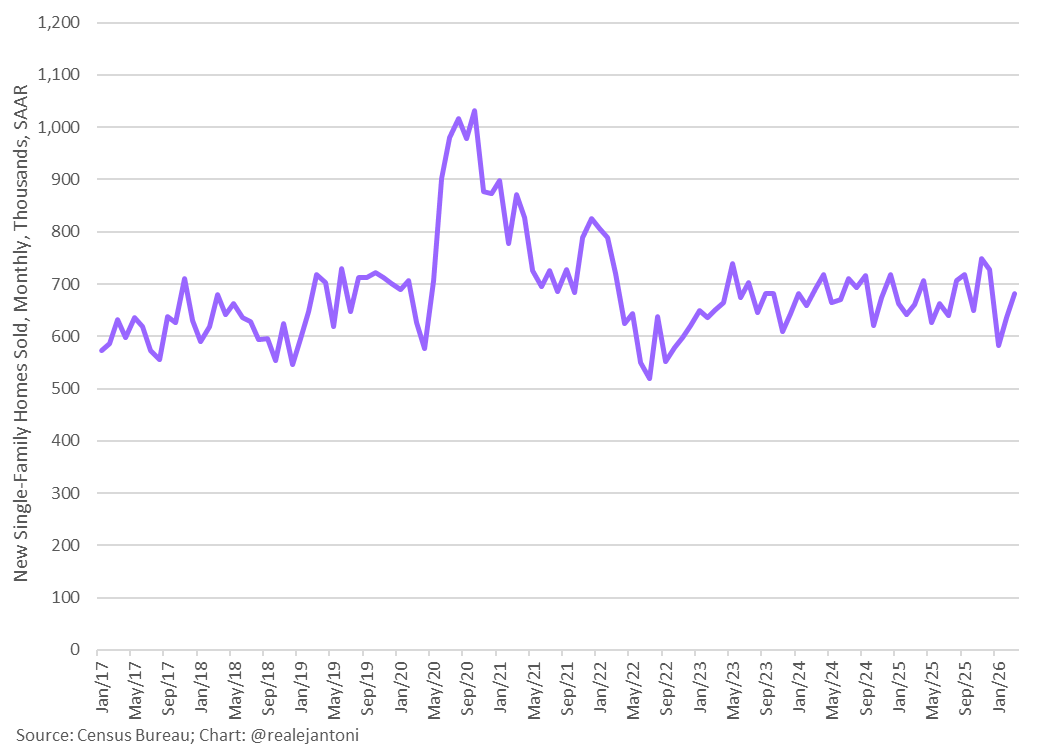

What is new home sales?
New home sales count the newly constructed single-family homes for which a sales contract was signed in a given month, regardless of whether construction is complete. The U.S. Census Bureau, in partnership with the Department of Housing and Urban Development, publishes the figure monthly, typically in the final week of the following month.
The headline number is expressed as a seasonally adjusted annual rate (SAAR): raw monthly counts are adjusted for predictable seasonal swings and annualized to make readings comparable across time. A reading of 682,000 means the monthly pace, if held for a full year, would produce 682,000 new home sales nationally.
Think of SAAR as converting a single lap time into a projected race pace. One fast lap doesn't tell you the driver wins; it tells you whether pace is building or slipping.
Why it matters
New home sales reach the broader economy through several channels.
- Residential investment flows directly into GDP, and new construction carries a higher multiplier than existing home sales because it pulls forward spending on labor, materials, and furnishings.
- Each new home start supports roughly three full-time jobs across construction and related trades, according to National Association of Home Builders estimates.
- The indicator reveals how effectively rate changes pass through to the real economy. When that relationship breaks down, something structural is happening.
- New home prices feed into owners' equivalent rent (OER) within CPI with a lag of 12-18 months. A sustained drop in new home prices today is a slow disinflationary force that may not show up in headline CPI until late 2027.
The March 2026 release runs through all four: volume rose +7.4% MoM to 682,000 SAAR, but median sales price fell to $387,400, down 6.2% year-over-year. Sales are recovering. Prices are not.
How to interpret it
Volume and price together tell more than either alone. The current data points to a deliberate trade by homebuilders: margin for throughput. With the 30-year fixed mortgage rate still above 6.3%, organic affordability has stalled. Rather than wait for the Fed, builders have cut list prices (median down over $21,000 year-over-year), offered mortgage rate buydowns, and absorbed the cost themselves. That's why new home sales are outperforming the existing market, where the lock-in effect (owners sitting on sub-3% pandemic-era mortgages who won't sell into a 6%-plus rate environment) continues to suppress supply.
March's months' supply reading of 8.5 months improved from February's 9.1 but remains well above the 4-6 month range associated with a balanced market. Historically, readings above 8 months have corresponded with downward price pressure, consistent with what builders are already delivering in their pricing.
For context on where 682,000 sits historically:
| Period | SAAR (approx.) | Context |
|---|---|---|
| 2005 peak | ~1,400,000 | Housing bubble |
| 2011 trough | ~270,000 | Post-crisis floor |
| Pre-pandemic baseline | 600,000-700,000 | Structural norm |
| March 2026 | 682,000 | Within normal range |
The current reading is not a boom. It's a return to baseline, achieved at a significant price concession.
Key takeaways
The headline bounce is real. What matters is how builders got there: they've become the housing market's de facto rate-relief mechanism, doing through price cuts and buydowns what the Federal Reserve has not yet done through policy. For investors, that means gross margin compression at publicly traded builders like D.R. Horton and Lennar. Revenue holds up, but earnings guidance deserves scrutiny. For anyone watching inflation, the sustained median price decline is a slow-burning disinflationary signal that will eventually surface in shelter CPI, just not soon. And for Fed watchers, the data confirms monetary transmission into housing is impaired, not because demand has collapsed, but because supply-side actors are pricing around the policy constraint.
Main sources
- U.S. Census Bureau: Monthly New Residential Sales, March 2026
- U.S. Census Bureau / HUD Joint Release PDF
- Freddie Mac Primary Mortgage Market Survey
- Federal Reserve Economic Data (FRED): New Home Sales
- Bureau of Economic Analysis: Residential Investment
- Calculated Risk: New Home Sales Increase to 682,000 Annual Rate in March
Discussion