


What the Consumer Price Index measures
The Consumer Price Index (CPI) tracks the average change in prices urban consumers pay for a fixed basket of goods and services, from groceries and rent to doctor visits. The Bureau of Labor Statistics (BLS) collects roughly 80,000 prices a month across 75 urban areas and weighs the cost of that basket against a base period (currently 1982-84 = 100) using a Laspeyres-type formula. The result is published monthly as the CPI for All Urban Consumers, or CPI-U.
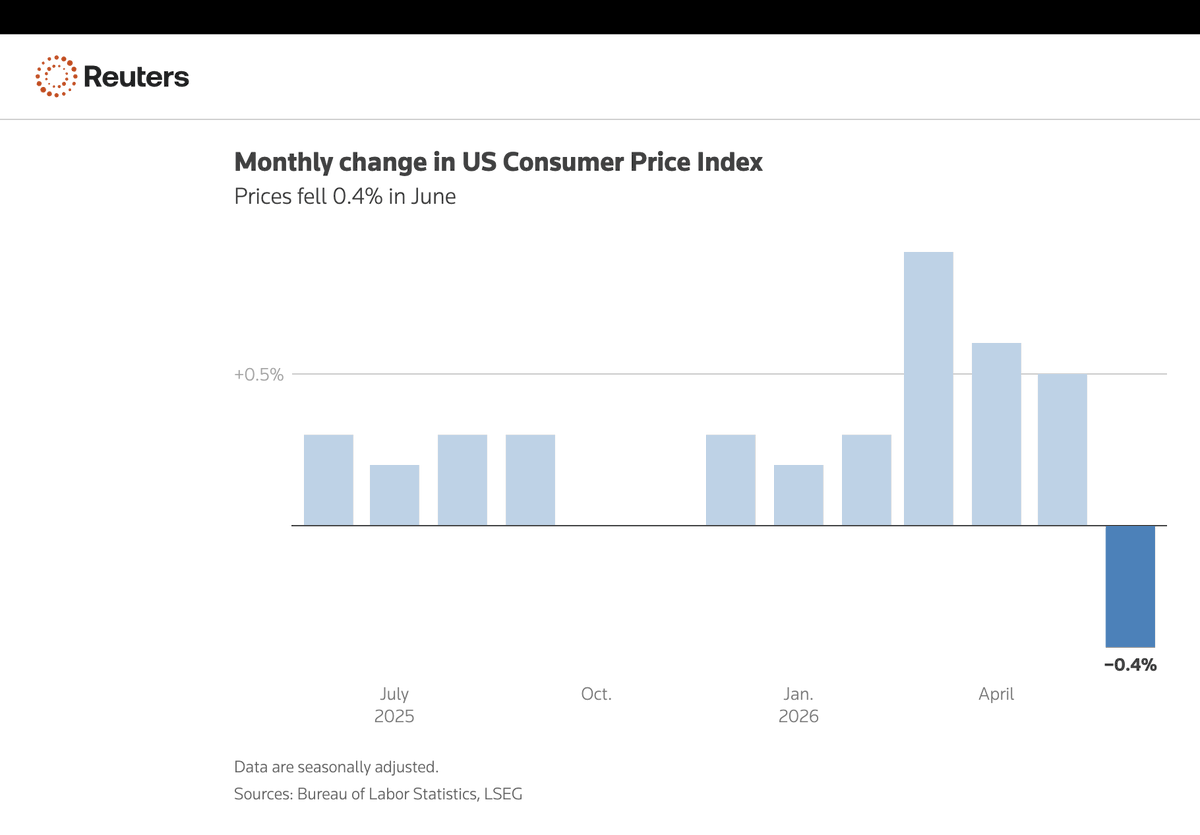
June's report, released July 14, makes a good teaching case: headline and core moved in almost opposite directions in terms of what they imply.
- Headline CPI (MoM, seasonally adjusted): −0.4% vs. forecast −0.2% (prior: +0.5% in May)
- Headline CPI (YoY): 3.5% vs. forecast 3.8%
- Core CPI (MoM): 0.0%, flat
- Core CPI (YoY): 2.6% vs. forecast 2.8% (prior: 2.9% in May, a seven-month high)
- Energy index (MoM): −5.7% vs. +3.9% in May
- Shelter (YoY): 3.3% vs. 3.4% in May
Why it matters
CPI feeds directly into Social Security cost-of-living adjustments, federal pension calculations, and countless private contracts. It's also the series markets watch most closely for clues on the Federal Reserve's next move: sustained deviation from the Fed's 2% target shapes the FOMC's rate path. A −0.4% headline print looks dramatic, arguably deflationary, at first glance. It isn't.
How to interpret it: composition over headline
The −0.4% drop is almost entirely a mechanical unwind. Energy prices spiked 3.9% in May when the Iran conflict disrupted oil markets; June's 5.7% energy decline is mostly that spike reversing, not new disinflationary momentum. The last time headline CPI fell this fast was April 2020's −0.8% print, but that was pandemic demand collapse, a different mechanism entirely from a geopolitical price shock unwinding.
The more useful number is core CPI, which strips out food and energy because those categories swing around for reasons that have nothing to do with the underlying trend. Core cooled to 2.6% from a seven-month high of 2.9%, helped by a modest easing in shelter. Shelter carries roughly one-third of the CPI-U weight. It's the single component the Fed watches most closely, even when everyone else is fixated on the headline. A one-off energy reversal tells the FOMC little about underlying price trends; a genuine cooling in owners' equivalent rent tells it a lot.
There's also a seasonally adjusted versus not-seasonally-adjusted distinction worth understanding. Monthly figures are seasonally adjusted to strip out predictable patterns, like gasoline prices rising every summer. Year-over-year comparisons use unadjusted data, reflecting what households actually experienced.
Key takeaways
- Headline CPI leans heavily on volatile categories like energy, and it can swing sharply on geopolitical shocks that have nothing to do with the underlying inflation trend.
- Core CPI, and shelter within it, is the more reliable gauge of persistent price pressure and the number the Fed leans on most.
- A single month's headline move rarely changes the policy trajectory; a multi-month trend in core does.
Discussion