


What is the CPI
The Consumer Price Index (CPI) tracks the average change in prices urban consumers pay for a fixed basket of goods and services. The Bureau of Labor Statistics (BLS) collects those prices in 75 urban areas, from about 6,000 housing units and 22,000 retail and service outlets. The headline measure, the CPI for All Urban Consumers (CPI-U), covers more than 90% of the US population. The CPI for Urban Wage Earners and Clerical Workers (CPI-W) covers about 30%.
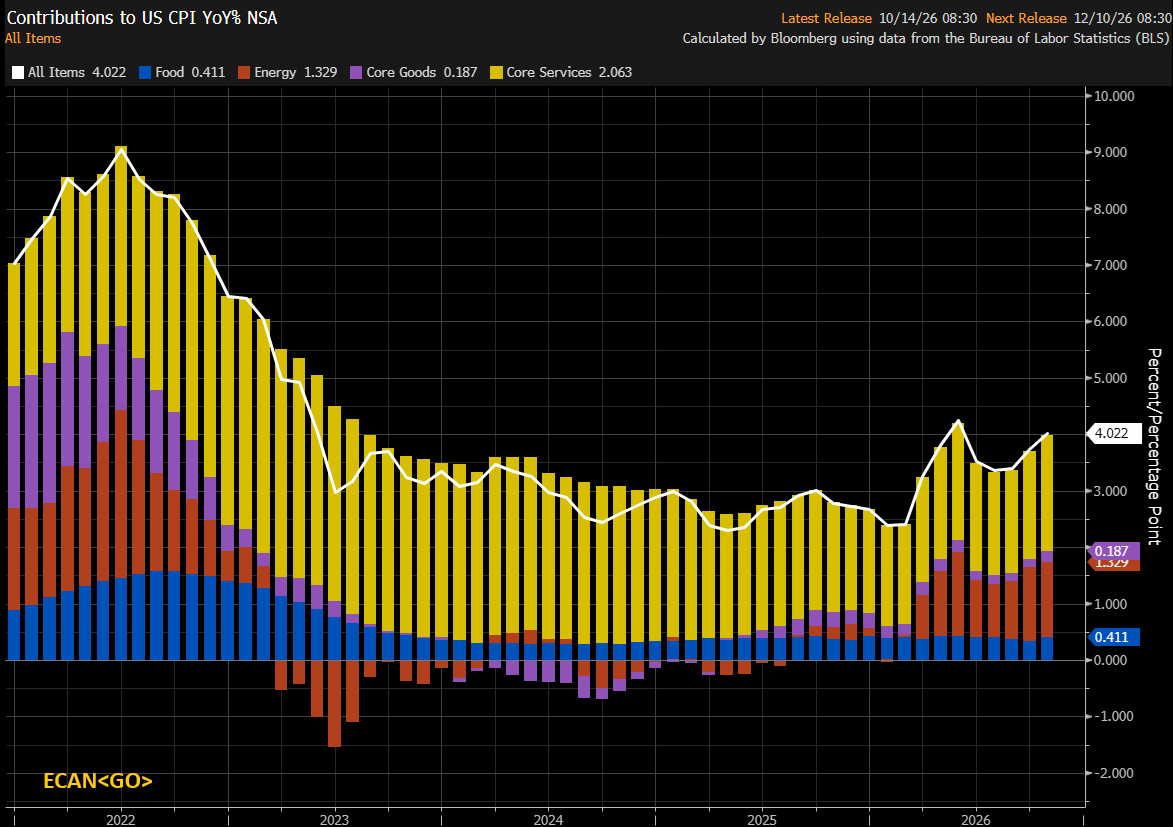
Every index is a ratio, and a ratio needs a denominator. The 12-month inflation rate in most headlines is this month's index divided by the same month a year earlier. BLS did not collect October 2025 survey data because of a lapse in appropriations, so most series have no official 12-month change for October 2026. A blank cell is not zero inflation.

Why it matters
Rents, wages and leases often escalate with the CPI-U, and Treasury Inflation-Protected Securities (TIPS) are indexed to the unadjusted CPI-U. Social Security's cost-of-living adjustment (COLA) runs off the CPI-W and compares third-quarter averages, so one missing month does not touch it.
The Federal Open Market Committee targets 2% inflation in the personal consumption expenditures (PCE) price index, which weights housing differently. The CPI still arrives first each month and gets the most attention.
How to interpret it
October's release shows what is left once the headline rate is gone:
- On the month, CPI-U rose 0.4% seasonally adjusted against 0.3% expected (previous: 0.6%). Core, which excludes food and energy, rose 0.3%. BLS puts the standard error of the one-month change at about 0.04 points, so a 0.1 point gap is unlikely to be sampling error alone.
- Compounding 0.4% a month for 12 months gives about 4.9% annualized, and 0.3% gives about 3.7%. That is arithmetic, not a forecast, and it is not an official CPI figure.
- The unadjusted CPI-U was 337.511 (1982-84 = 100), up 0.2% on the month. Unadjusted indexes are final when released, so the level is the safest reference for contracts.
Seasonal adjustment is the second lesson. Gasoline was +1.0% adjusted but −0.7% unadjusted. Gasoline prices normally fall from September to October, so a smaller-than-usual drop registers as a gain after adjustment. Think of a thermometer reading corrected for the season: the corrected number tells you whether it is warm for October, not whether it is warm. Adjusted data suit month-to-month comparison; unadjusted data are what people actually paid.
Shelter, at a basket weight near 35%, rose 0.3% and was the largest single contributor to the monthly increase. Food rose 0.5%. Energy rose 0.7%, after jumping 5.2% in September.
Key takeaways
- A 12-month rate is a ratio, and it vanishes when the base month does.
- Each alternative has a cost. Monthly changes are noisy, annualizing magnifies that noise, and index levels carry no direction on their own.
- Adjusted and unadjusted series can point opposite ways, and contracts and TIPS follow the unadjusted one.
- Check the BLS release schedule for when a 12-month rate returns. The first comparison may still carry distortions from how BLS filled gaps in late 2025, so read it with care.
Main Sources
- Consumer Price Index Summary, October 2026 (BLS)
- October 2026 12-month percent changes (BLS)
- Approximating missing CPI data (BLS)
- CPI-U special aggregate indexes, Table 3 (BLS)
- Social Security cost-of-living adjustments (SSA)
- Treasury Inflation-Protected Securities (TreasuryDirect)
- Statement on Longer-Run Goals and Monetary Policy Strategy (Federal Reserve)
Listen to this article
Prefer audio? The full piece, read aloud.
Discussion